
Beyond Utilization Rate:
How Organizations Are Measuring Workplace Performance in 2026
Badge swipes don’t answer the question. Here’s what does.

Most organizations measure badge swipes. High performing workplaces measure something different entirely.
Organizations are spending more on talent, technology, and real estate than at any prior point in the hybrid work era — yet most still cannot answer a basic question: is our workplace actually working?
Average global office utilization sits at 54%, while organizations are targeting 79%: a 25-point gap, according to the JLL 2025 Global Occupancy Planning Benchmark Report. That gap is not simply an occupancy problem. It is a measurement problem. Organizations closing it have moved beyond headcount tracking to signals that connect space inputs to employee experience to business outcomes.
This article uses the Space–Experience–Outcome framework, developed from Maptician’s work with 100,000+ professionals across 16 industry verticals, as the organizing lens. Most organizations only measure the first layer. This article covers all three.
Why Utilization Rate Alone Is No Longer Enough
Utilization rate remains the most commonly tracked occupancy metric — but it only tells you if space is occupied, not whether it’s producing value. A building can register 80% occupancy and still be failing: if employees show up, sit in isolated workstations, and leave without a single meaningful cross-team interaction, the space is full but not performing.
The JLL 2025 Global Occupancy Planning Benchmark Report found that 90% of organizations still rely on badge swipes as their primary occupancy data source, while only 49% use reservation systems. Even combined, these methods cannot tell you whether the workplace is enabling the work that matters.
AshLea Allberry, COO of Maptician, put it directly in Maptician’s March 2026 webinar: “Badge swipes tell you nothing about collaboration. You really need to feel how your employees feel, listen to them, and adjust.”
Gallup’s State of the Global Workplace 2025 Report found that global employee engagement fell to 21% in 2024 — matching COVID-era lows — at an estimated cost of $438 billion in lost productivity. A full office that doesn’t produce engagement, collaboration, or connection is still a loss.
The Five Metrics That Actually Predict Workplace Performance
Leading organizations have moved beyond efficiency metrics to behavioral and experiential signals. Here’s what they’re measuring

Collaboration Quality
Most organizations measure collaboration in square footage. High performing workplaces measure whether it’s actually happening: cross-team meeting frequency, cross-floor interaction rates, who is coming in with whom.
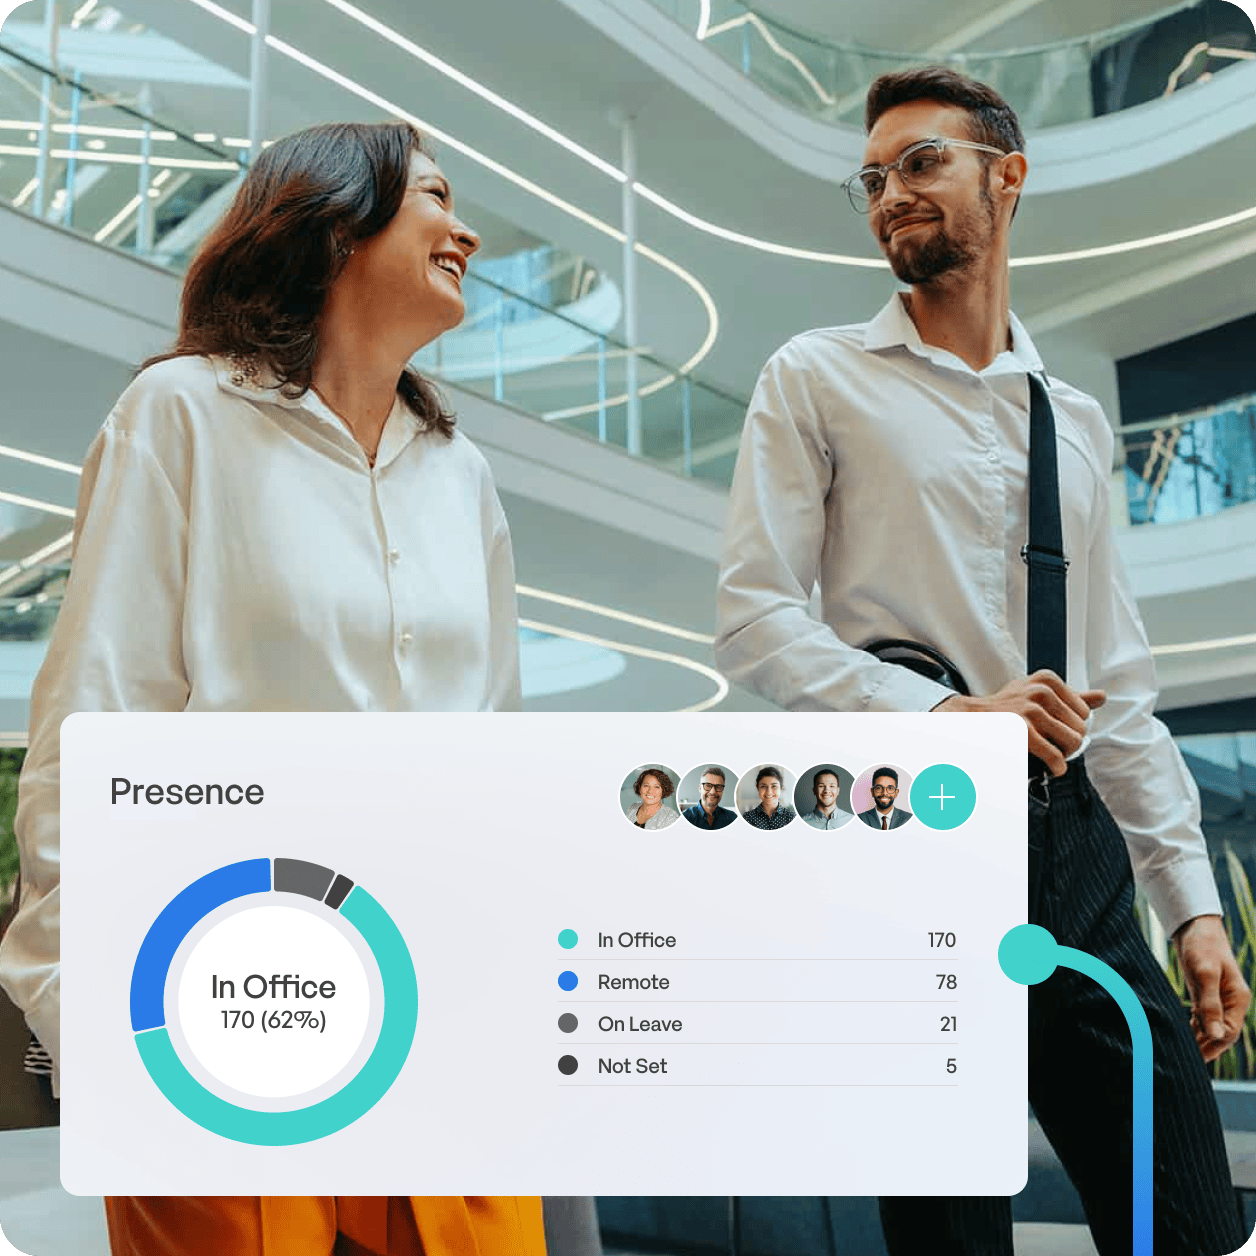
Maptician’s real-time presence visibility and interactive floor plans address this directly: when employees can see who is in the office and where, intentional collaboration becomes easier and spontaneous connection more likely.
Connectivity: The Perception Gap Is a Real Estate Problem
As organizations expand across floors, organic connectivity deteriorates faster than leaders realize, and seniority insulates them from the fragmentation their teams feel daily.
Nelnet (7,000+ associates, 24 offices) experienced this after expanding from two floors to seven, describing it as managing six different companies. Maptician’s workplace management software is helping Nelnet reconnect those floors through presence visibility and booking tools that make cross-floor interaction visible and intentional. Occupancy analytics that track only building-level density miss this kind of floor-by-floor fragmentation entirely. Multi-floor presence visibility is not a convenience feature, it’s a measurement requirement.
Desk Utilization Rate vs. Occupancy Rate
Occupancy rate tells you if the building is full. Desk utilization rate tells you which zones, floors, and neighborhoods are genuinely performing — accounting for ghost bookings, partial-day use, and no-shows, critical for setting rational seat ratios in hot desking programs.
Maptician tracks desk utilization at the neighborhood, floor, and individual desk level, surfacing these patterns without custom configuration.
Meeting Room Utilization: The Most Wasted Real Estate
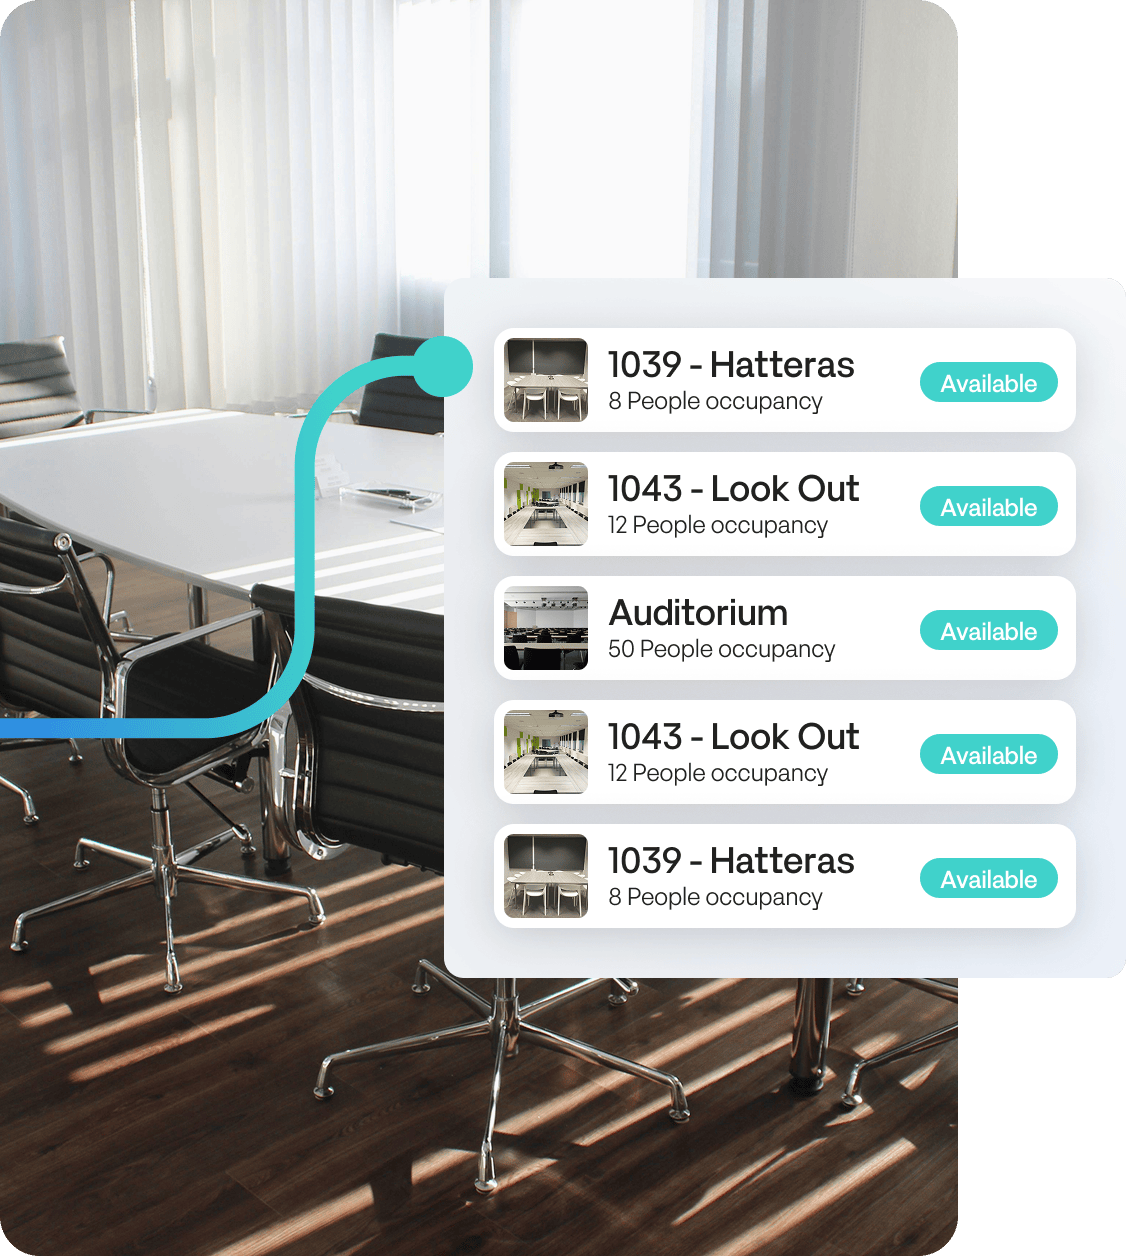
Ghost bookings inflate apparent utilization while rooms sit empty. Calendar data alone can’t fix this — you need booking data and real-time occupancy confirmation together. Maptician’s conference room scheduling captures both layers.
This is particularly consequential for law firms, where room management is both an operational discipline and a client service standard, Maptician currently serves approximately 20% of the Am Law 200.
Space-to-Outcome Alignment
Most organizations only measure inputs. The Space–Experience–Outcome framework, developed from Maptician’s work with 100,000+ professionals across 16 industry verticals, covers all three:
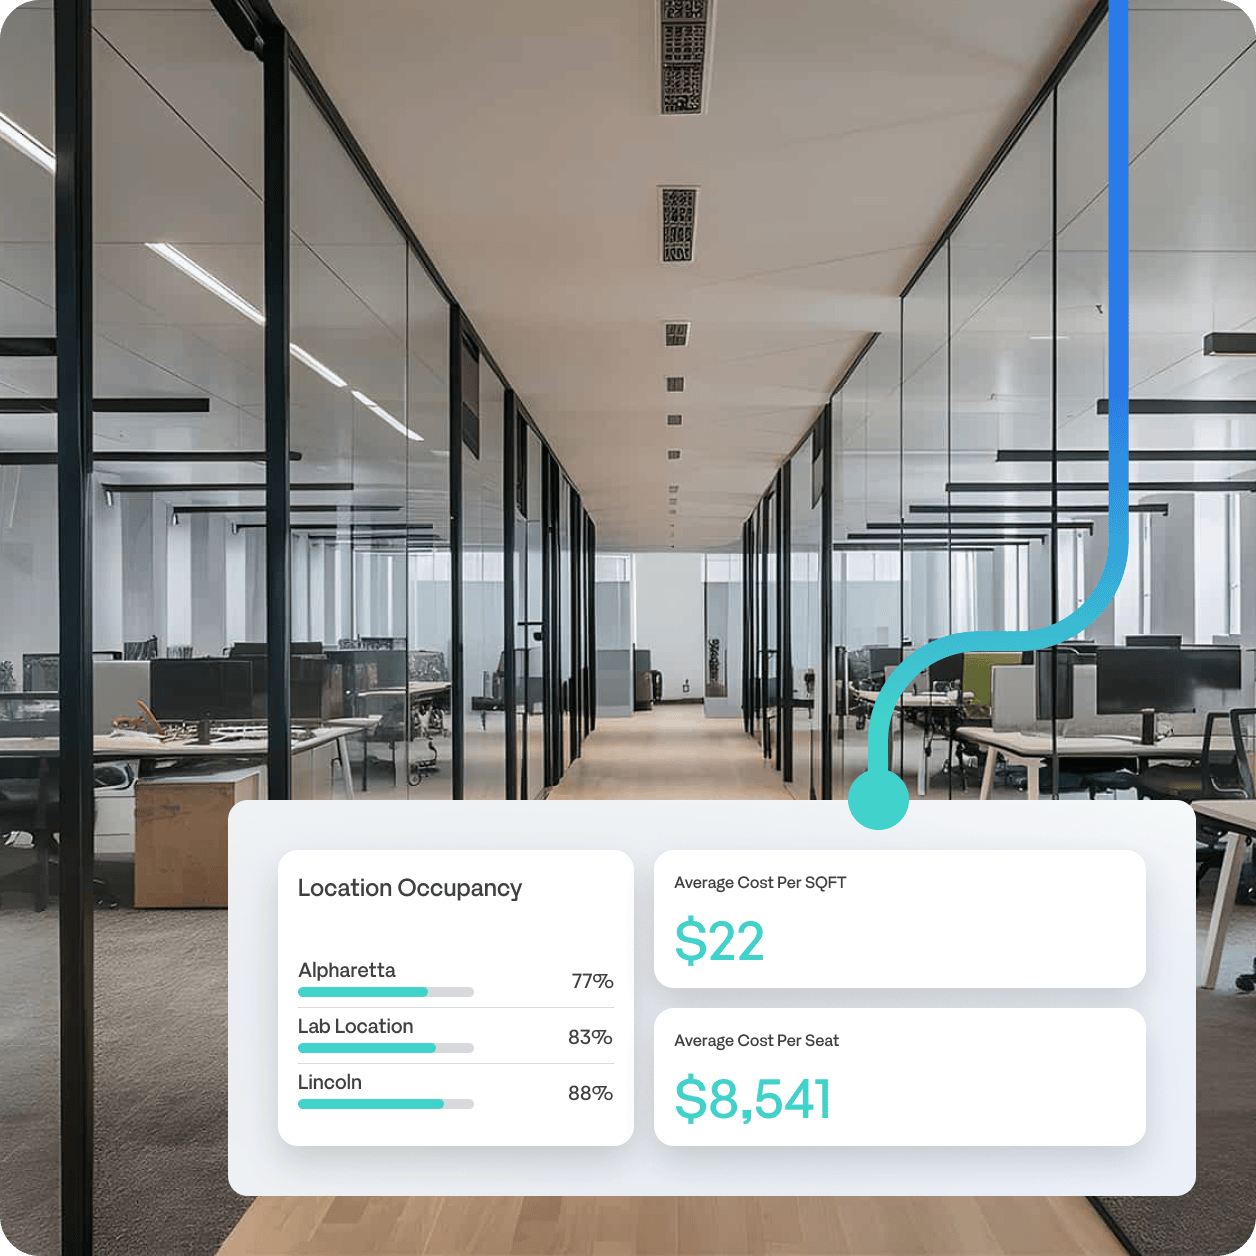
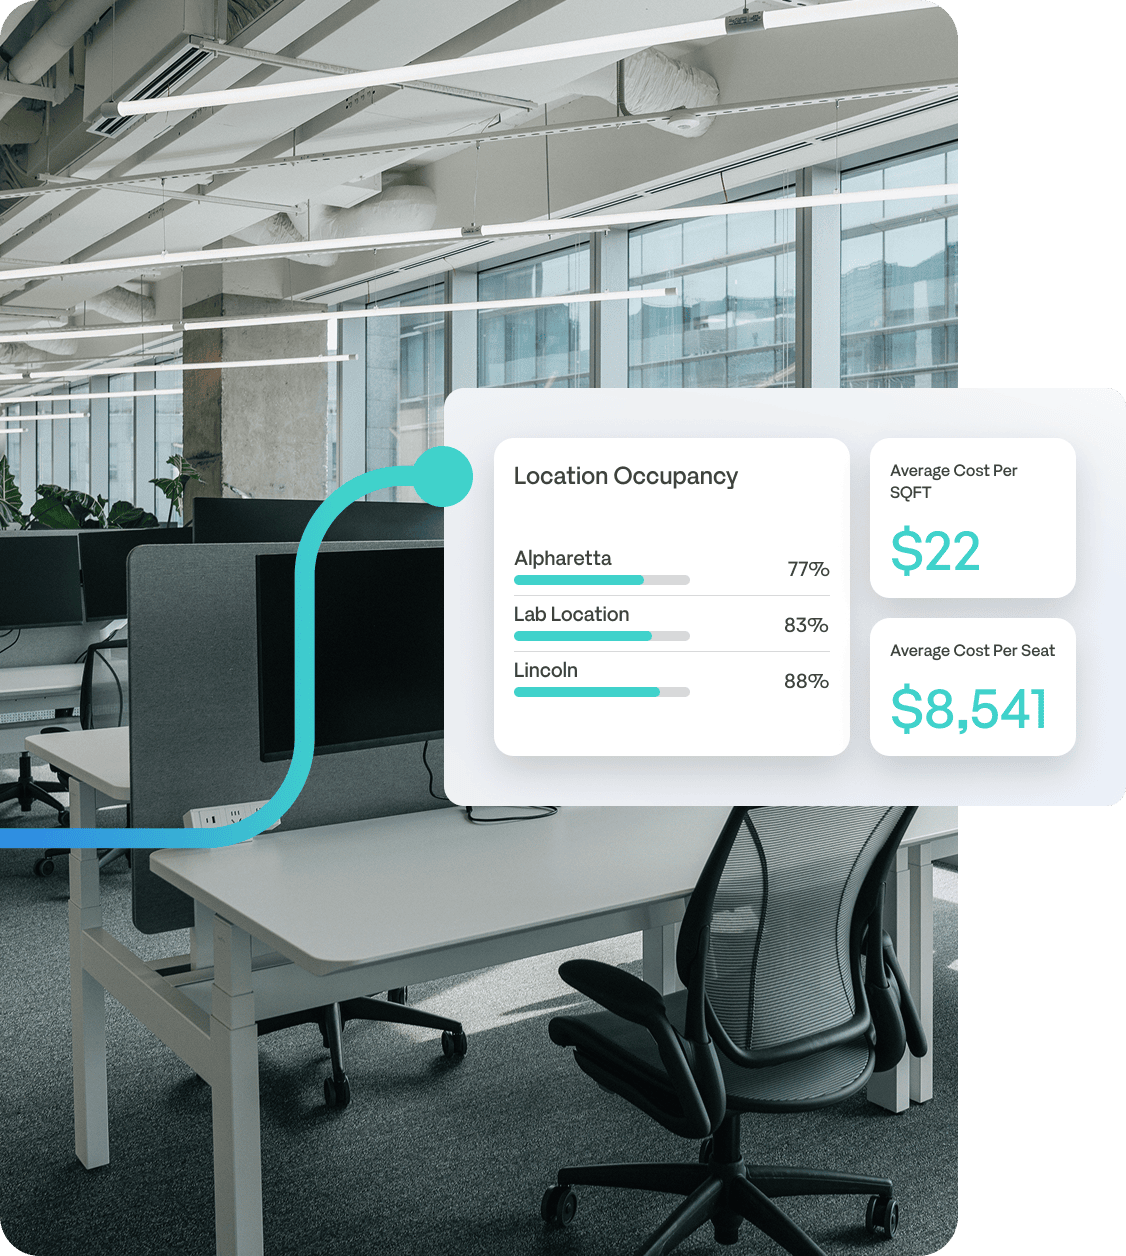
- Space metrics (inputs): desk utilization by zone, room types used, real estate cost per occupied seat
- Experience metrics (process): booking ease, mobile access, seat preferences, who’s coming in with whom
- Outcome metrics (outputs): collaboration frequency, cross-department interaction, retention rates, engagement scores
The Five Strategic Shifts Reshaping How Organizations Manage Space in 2026
Nic Rapacz, VP of Sales at Maptician, identified five structural shifts observed across the 100,000+ professionals Maptician serves across 16 industry verticals.
1. Flexible seating is now the default.
The JLL 2025 Global Occupancy Planning Benchmark Report shows seat-sharing targets increasing from 1.1 to 1.3 people per desk. Space management software must support hot desking, neighborhood configurations, and flexible seating rules. Organizations still managing space through fixed assignments are structurally mismatched with how their workforce actually shows up.
2. Collaboration space is expanding.
The office is shifting from a location for individual work to a destination for connection. Space planning software needs to track how collaboration zones are being used, not just whether they exist.
3. Technology is maturing but still fragmented.
Most organizations have foundational tools: room booking, occupancy sensors, calendar integrations, but these systems rarely share data. The next phase of maturity is connected data: platforms that produce a unified picture rather than multiple partial views.
4. Incentives, not mandates, drive in-office behavior.
Policies that rely solely on attendance requirements consistently underperform relative to organizations that create genuine reasons to come in: meaningful collaboration, visible leadership, structured team moments. Working with natural peak-attendance patterns, rather than against them, is the more effective strategy.
5. Real-time data is becoming a core management discipline.
Organizations are moving from quarterly occupancy reports to live dashboards reviewed weekly or daily. Space utilization software with real-time analytics enables faster decisions about configuration, right-sizing, and policy adjustments. Historical reporting alone is no longer sufficient.
What Good Workplace Performance Measurement Actually Looks Like
Organizations measuring workplace performance effectively in 2026 share several structural characteristics, and none of them rely on a single metric.
Connect Space Data to People Data
High-performing organizations track not just how many desks are used, but who is using them and when.
Department attendance patterns, team alignment on peak days, and cross-floor interaction frequency all require booking and presence data unified in a single platform. When these data sets live in separate systems, the picture is always partial, and the decisions built on it are, too.
Track the Utilization Gap
The 25-point gap between actual utilization and organizational targets, documented in the JLL 2025 Global Occupancy Planning Benchmark Report, is the most operationally useful single metric in workplace management.
For most mid-sized organizations, the real estate cost of that gap is significantly larger than leadership estimates, and rarely surfaces until someone calculates it explicitly.
Measure Experience, Not Just Occupancy
Booking simplicity, mobile access, preferred seat availability, and visibility into where colleagues are working determine whether employees will voluntarily use the systems organizations put in place.
Gallup research finds that organizations with high employee engagement see 23% higher profitability, a connection that runs directly through whether the workplace experience encourages people to show up and engage, or discourages them from doing so.
Use an Integrated Platform instead of Multiple Disconnected Tools
When room booking, desk booking, occupancy sensor data, and HR data live in separate systems, the numbers rarely agree and reconciliation consumes whatever operational advantage the data might have provided.
Maptician unifies desk booking, hot desking, room scheduling, visitor management, occupancy analytics, and interactive floor plans in a single platform, a single source of truth for every decision from daily space allocation to long-term portfolio strategy.
How Maptician Approaches Workplace Performance Measurement
Maptician serves more than 100,000 professionals across 16 industry verticals. Approximately 20% of the Am Law 200 use Maptician as their primary space management platform.
The platform covers space utilization, occupancy trends, team-level analytics, visitor patterns, and real estate ROI metrics. For organizations that need more, Maptician works directly with clients to build custom analytics views: mapping the specific combination of attendance patterns, space preferences, and real estate data that each organization’s leadership needs to make decisions. The questions that matter most are rarely answered by a standard dashboard.
Most organizations are fully live with floor plans, hot desking, visitor management, and analytics in approximately three weeks, compared to months for traditional IWMS platforms. Maptician is SOC 2 and ISO certified, meeting the security and data governance standards required by financial services firms and law firms.
Three Things to Measure Before Your Next Real Estate Decision
Before any decision about office footprint: expanding, consolidating, or redesigning, organizations should have clear data on three things.
Measure Practices, not just Presence.
Track desk and room utilization, then layer in who’s coming in with whom and what work is happening in person. The behavioral layer explains why the numbers look the way they do.
Connect Space to Organization Needs.
The in-person premium is collaboration, mentorship, and connectivity. Ask whether your space configuration is supporting those outcomes — with data, not impressions.
Calculate your Utilization Gap.
Compare actual vs. target utilization. That gap in square feet and cost per square foot is the business case for right-sizing. For most organizations, it’s larger than leadership believes.
Frequently Asked Questions
What is the difference between occupancy rate and desk utilization rate?
Occupancy rate measures the percentage of total office capacity in use at a given time, typically calculated as the number of people present divided by total capacity. Desk utilization rate is more granular: it measures the percentage of individual desks that are actively used, accounting for ghost bookings, partial-day use, and no-shows. Desk utilization rate is more actionable for hybrid space planning because it reveals which specific zones, floors, or neighborhoods are underperforming — not just whether the building is busy.
What is a good office space utilization rate in 2026?
According to the JLL 2025 Global Occupancy Planning Benchmark Report, the global average is 54%, against an organizational target of 79% — a 25-point gap. For desk utilization specifically, optimal benchmarks fall between 70–80%. Meeting room utilization targets are typically 60–75%.
What metrics should organizations track to measure workplace performance?
Beyond occupancy rate, high-performing organizations track desk utilization rate by zone and floor, meeting room utilization (booked versus actually occupied), cross-team collaboration frequency, employee experience scores tied to space, and real estate cost per occupied seat. The Space–Experience–Outcome framework: measuring inputs (space metrics), process (experience metrics), and outputs (collaboration, retention, engagement), provides the most complete picture of whether the workplace is actually working.
How do you improve office space utilization?
Improving office space utilization starts with measuring the right things. First, audit desk utilization rate and meeting room utilization separately — ghost bookings and no-shows typically inflate apparent utilization while space physically sits empty. Second, calculate your utilization gap: compare actual utilization against your target (the JLL 2025 Global Occupancy Planning Benchmark Report puts the global average gap at 25 points). The real estate cost of that gap is almost always larger than leadership expects. Third, adjust seat ratios for hot desking based on actual peak-day attendance patterns, not assumed capacity. Finally, use presence data to align zone configurations with how teams actually use the office — which floors, neighborhoods, and room types are performing, and which are consistently underused. Platforms like Maptician surface all of this through a single space utilization analytics dashboard, replacing the manual reconciliation most organizations currently rely on.
What is space management software?
Space management software helps organizations track, analyze, and optimize how physical office space is being used. It typically includes desk booking and hot desking, meeting room scheduling, interactive floor plans, occupancy analytics, and real-time presence visibility. Modern platforms like Maptician combine all of these functions in a single system, replacing the fragmented mix of separate booking tools, sensor platforms, and reporting tools most organizations currently rely on.
What is the best space management software for hybrid offices?
The best space management software for hybrid offices integrates desk booking, hot desking, meeting room scheduling, occupancy analytics, and presence visibility in a single platform. Maptician is designed specifically for this use case, with fast deployment (approximately three weeks to full go-live), a mobile-first employee experience, particularly well-suited for professional services and financial services organizations requiring SOC 2 and ISO certification.
How long does it take to implement space management software?
Simpler desk booking tools can be live within days. Traditional IWMS platforms often take months and require dedicated IT resources. Full-featured platforms like Maptician typically reach full go-live in approximately three weeks, including interactive floor plans, hot desking policies, visitor management, and occupancy analytics, making it one of the fastest deployments for a platform of its breadth.